
Copy Right Michael Kostiuk (2002)
Vertical Datums
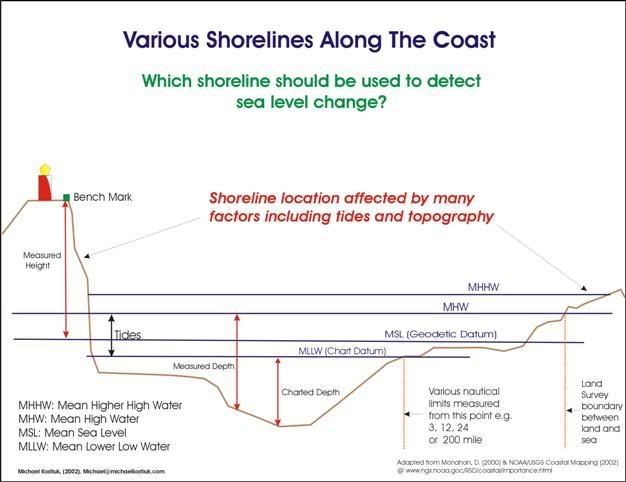
Since the sea level changes from a maximum high tide to a maximum low tide a variety of vertical datum have been created for special purposes by a many different types of organizations around the world. According to the USGS and NOAA (August, 2002) there are 27 different vertical datums in use. These different datum are either based around an Orthometric (geodetic) level which is based on Mean Sea Level (MSL) or they are based on tidal measures of the high and low water line at the land and sea interface. The advent of GPS has added a newer form of vertical datum and since it is based on 3 points it is referred to as a 3-D datum. Some other types of datum are Mean Higher High water (MHHW), Mean High Water (MHL) and Mean Lower Low Water (MLLW). Mean Lower Low Water level is also referred as Chart datum for hydrographic charts. Mean Seal Level (MSL) is used by the USGS as the vertical datum for the production of its topographic maps. These specific MSL orthometric levels are known as North American Geodetic Datum 1929 (NGVD) or the newer North American Vertical datum (NAVD 88). The choice and use of different vertical datum by various mapping organizations around the world means that there are many definitions of where the shoreline is located. Since at least one reliable cartographic baseline is required to measure sea level change it is vitally important to select the same vertical datum for both the reference geographic data and the newly acquired remote sensing data. Otherwise any attempt at change detection will be adversely affected by the different vertical datums. Once a vertical datum has been selected the next step is to acquire reliable and accurate geographic data of the shoreline to use as a baseline reference.
Establishing the Vertical Datum
A first step to consider when using aerial images and remote sensing data to measure a coastal zone area is to decide on which vertical datum to use to define the shoreline. A statement on the vertical datum is not normally supplied with the LANDSAT 5 data, and some method must be found to establish the preferred vertical datum for the coastline. One method of determining the preferred location of the coastline is to acquire the images when the tide is at its maximum high tide cycle. This can be done by checking the tide tables to see when the high tide period is going to occur. Acquiring aerial images during the high tide cycle is a method used by mapping organizations to identify the location of the coastline. The Geomatics division of Natural Resources Canada’s National Topographic System 1:50,000 Standards and Specifications manual defines the high water mark (MHW) according to various conditions such as:
Tidal waters:
i) The water’s edge at the time of photography, if the tide is high according to the tide tables of the Canadian Hydrographic Service.
ii) The demarcation line caused by the change in vegetation or the deposit of sea debris if the tide is not high according to the tide tables of the Canadian Hydrographic Service.
iii) The zero contour if the tide is not high and the demarcation line cannot be seen. (Geomatics Canada, 1997, p. 25/34).
The MHW is used to define the coastline on other topographic maps such as the USGS 1:24,000 scale-based quadrangle maps that cover the coastline of the United States of America. Another method to locate the high tide line on aerial images is to use historical tide records of the area, and then to locate an archived aerial image or remote sensing image that was taken during a peak high tide cycle. It is also much easier and more practical to compare the LANDSAT digital spatial data to other forms of digital spatial data if they contain the same parameters such as map projections, map units and horizontal and vertical datums. Using the same cartographic specifications in both case studies also ensures the spatial analysis is based on a consistent methodology.
Selecting Baseline Data
Spatial data that are being used for spatial analysis for coastal zone management applications such as detecting sea level change can come from a wide variety of sources and they may be used for purposes that the spatial data were not designed to support. The type of spatial data that are selected should be matched to the specific coastal zone management task that is to be performed (such as seal level change). For example, small-scale spatial data should be used for the creation of maps for an atlas, medium scale maps should be used for spatial analysis on an urban or regional scale, and large-scale maps should be used for various civil operations such as in road building or for the construction of bridges. The case studies described for this paper uses analogue and digital spatial data that has been obtained from various sources and their various features of scale, precision, accuracy and resolution were explored by using an GIS (ArcView) to measure the area and length of the coastal area of Cobscook Bay, Maine. Spatial data can come in many forms and it can also cover a wide variety of temporal periods and geographic areas. It should be kept in mind that an error or inaccuracy in a paper (analogue) map is often compounded when it is digitized into spatial data.

Still None Awesome so far » Be the 1st Awesome to Using Remote Sensing Data to Detect Sea Level Change
Post a Comment